How to Pick a Winner in Horse Racing: A Data-Driven Guide
Loading...
No hunches. No hype. Just form, data and method.
This guide breaks down the analytical framework that separates consistent winners from recreational punters — covering form study, going analysis, speed figures, trainer stats, draw bias and value betting across UK racing. Whether you are studying the Flat turf season or preparing for the Cheltenham Festival, the principles here are built on decades of race data, academic research and the methods professional analysts actually use.
Why Method Beats Intuition Every Time
British horse racing is enormous. The industry contributes an estimated £4.1 billion to the UK economy, supports roughly 85,000 jobs and in 2025 drew over 5.03 million racegoers through the turnstiles — the first time attendance cleared the five-million mark since before the pandemic, according to the BHA Racing Report 2025. Record prize money of £194.7 million was distributed that year. Meanwhile, remote betting on horse racing generated £766.7 million in gross gambling yield during the 2024–25 financial year, per the Gambling Commission's annual report. That is an extraordinary amount of money flowing through a market where the vast majority of punters have no structured method for picking a winner.
Here is the uncomfortable truth: most recreational bettors lose because they rely on instinct, tips from friends, or a horse whose name sounds funny. There is nothing wrong with having a punt for entertainment. But if you want to pick winners with any consistency, you need a repeatable process that weighs the evidence — past form, ground conditions, speed data, trainer patterns, market prices — and then asks one disciplined question: is this horse's chance of winning greater than the price implies?
That question is the backbone of this guide. Every section that follows builds a layer of your analytical toolkit. Some layers matter more in certain race types than others: draw bias is critical at Chester but largely irrelevant at Ascot over a mile and a half; going preference can flip a form book upside down when heavy rain hits a Good-to-Firm card. The skill is in knowing which factors carry the most weight for the race in front of you — and discarding everything that does not.
This is not a get-rich-quick system. Anyone selling one of those is lying to you. What this is, instead, is a framework grounded in publicly available data, peer-reviewed research and the analytical habits of people who study racing for a living. The favourite wins roughly a third of all races. That means two-thirds of the time, something else comes home first. Identifying which "something else" at a price that represents value — that is the entire game. Gambling involves risk and no method eliminates variance, but a good method gives you a structural edge over time, provided you apply it with discipline and stake sensibly.
The Five Filters That Actually Find Winners
- Between 75% and 80% of winners come from the top five in the betting market — start your analysis there, not with the full field.
- Going preference is the most underrated filter: 71–85% of UK races are run on Good ground, so form compiled on extreme going reshuffles the entire form book.
- Horses running below class par in speed figures win just 4% of handicaps — one number eliminates a quarter of most fields.
- Draw bias at courses like Chester (63% of sprint winners from stalls 1–3) and pace dynamics (lone front-runners outperform by 35%) are structural edges most punters ignore.
- Value, not selection, is the edge: odds-on favourites win 59% of races, but blind favourite-backing returns only 93p in the pound. Bet where your probability estimate exceeds the price.
Contents
Narrow the Field — Where 75% of Winners Hide
A typical UK handicap might have twelve to sixteen runners. Attempting to analyse every single one with equal depth is a fast track to analysis paralysis. The first practical step in picking a winner is narrowing the field — and the data here is emphatic.
According to research by Inform Racing, between 75% and 80% of all winners come from the top five in the betting market. In races with seven to twelve runners, a three-day sample of 48 races showed 90% of winners emerged from the market's top five. That does not mean the favourite always wins — it means the collective market intelligence, for all its flaws, does a reasonable job of identifying the horses most likely to be involved at the finish.
Favourites themselves have a mixed record. At the 2024 Grand National Festival, favourites won 7 of 21 races — a 33% strike rate — including I Am Maximus in the Grand National itself. That figure sits squarely within the long-term average. Over twenty years of British racing, the favourite wins around 34% of the time. The second favourite wins roughly 20%, the third about 13%. Collectively, the top three in the market account for 65–70% of all winners.
So the first filter is simple: look at who the market fancies. You are not blindly backing favourites — you are using the market as a starting grid. From the top five or six in the betting, you apply your own analysis — form, going preference, trainer intent, speed figures — to separate the genuine contenders from the horses the public has overrated. The market gets you into the right neighbourhood. Your analysis finds the right house.
Between 75% and 80% of all winners come from the top five in the market. Start your analysis there, then apply your own filters to separate value from hype.
This approach also saves time. Instead of dissecting fifteen sets of form, you are working deeply on five or six. That depth is where edges are found — in the detail the casual punter glosses over. A horse who looked poor last time out on heavy ground but thrives on today's good-to-firm; a trainer whose seasonal pattern says March is their month for handicappers. Those details live in the shortlist, not the full field.
Form Analysis — Reading Past Performance
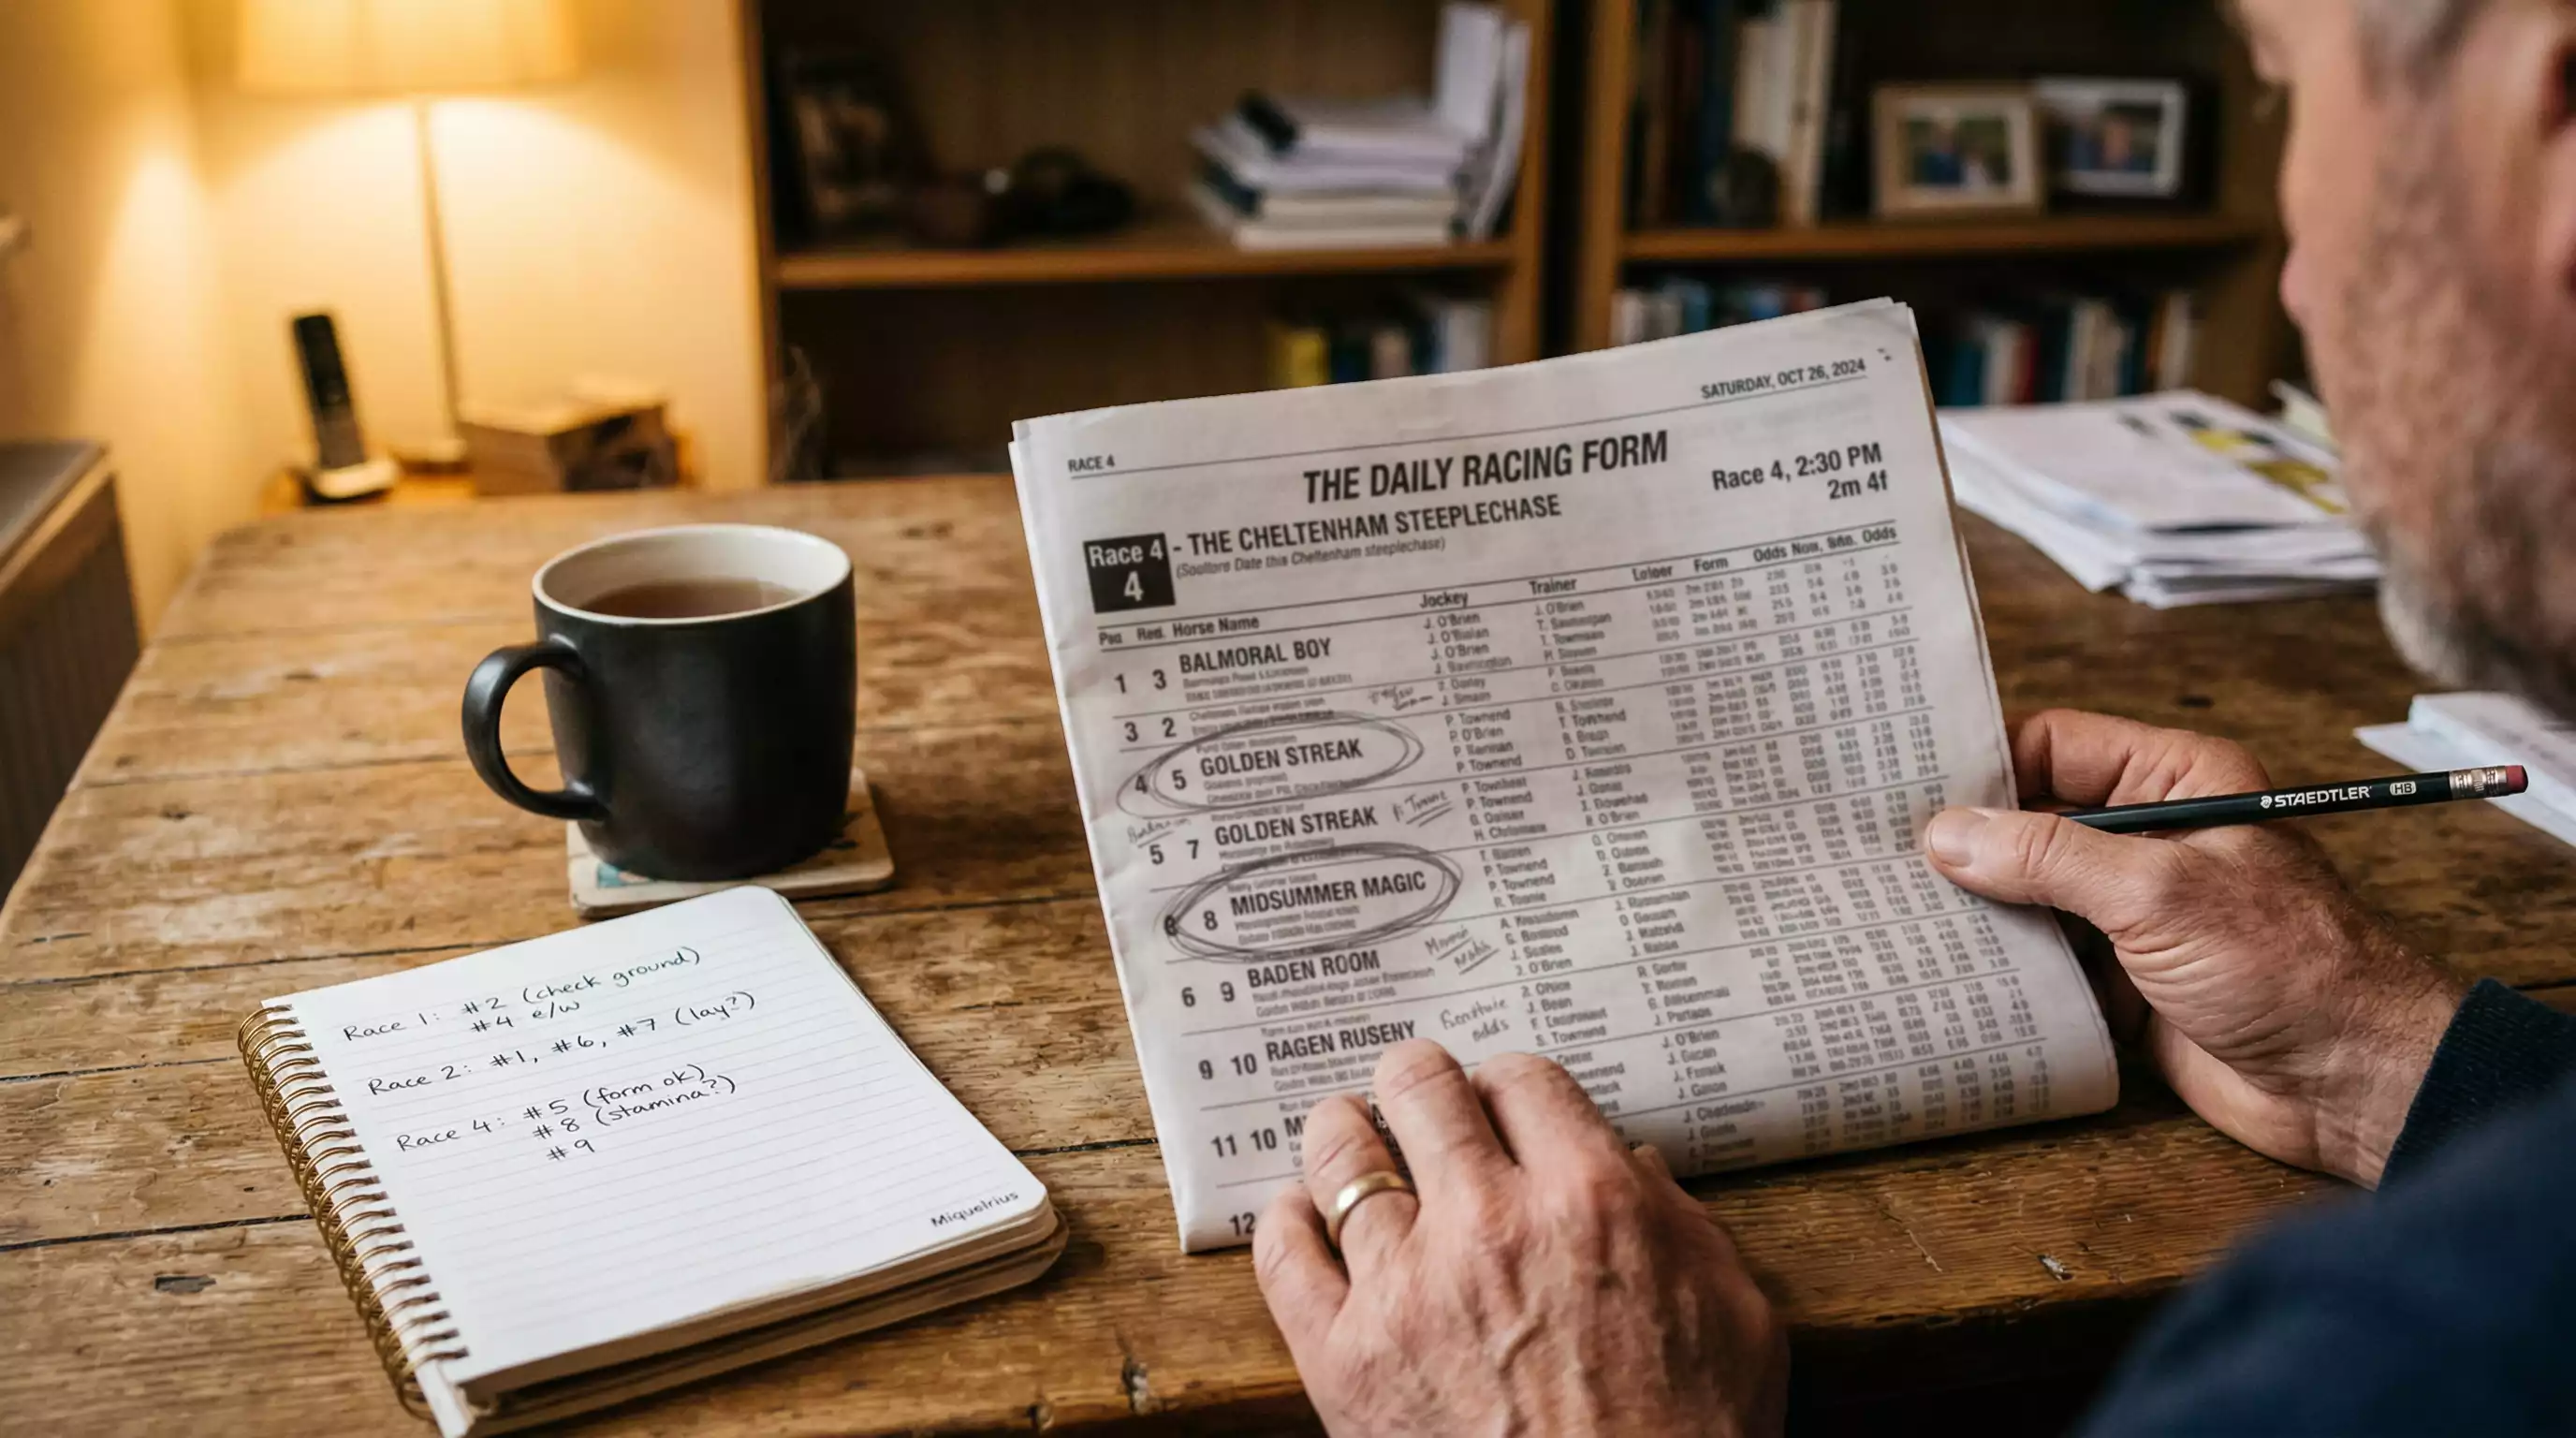
Form is the historical record of how a horse has performed. Every run is logged — finishing position, distance beaten, going, weight carried, class of race, draw, jockey, trainer. That data sits on a racecard, compressed into shorthand that looks impenetrable at first glance but becomes second nature once you know the code. Reading form is the single most important skill in picking winners.
"An important thing to emphasise about any formalised approach to racing analysis — especially numerically-based ones like ratings and times — is that by engaging with the puzzle in such a way you get to understand your subject better," says Simon Rowlands, former Head of International and R&D at Timeform. "That has benefits over and above simply picking winners."
The form figures beside a horse's name show its recent finishing positions, read left to right from oldest to most recent. A sequence like 3-1-2-5-1 tells you the horse finished third, won, ran second, finished fifth, then won again last time out. Letters carry meaning too: F is a fall, U is unseated rider, P is pulled up, 0 means finished outside the first nine. A dash separates seasons. The letter C beside a placing means it won at this course; D means it won over this distance. A horse marked CD at today's track and trip immediately earns extra scrutiny.
But raw finishing positions are only the surface. The real analytical value lies in context. A horse that finished fourth of six in a Group 1 at Ascot was likely running against far better opposition than one that won a Class 6 seller at Wolverhampton. You need to look at the class of the race, the quality of the horses it beat or was beaten by, and the margin. Was it beaten a nose by a subsequent winner, or trailed in twelve lengths behind a moderate field? These distinctions are everything.
A twenty-year study of British racing found that the favourite wins approximately 34% of races, the second favourite around 20%, and the third about 13%. That data, drawn from a comprehensive analysis covering 2002 to 2021, gives you a baseline for calibrating expectations. If you fancy a horse whose form profile makes it the clear second or third in the market, you know statistically it should win roughly one in five or one in seven or eight attempts — useful for assessing whether the price is right.
Recent form carries more weight than distant history, but not blindly. A horse returning from 200 days off has no recent form to assess — but its campaign pattern might tell you the trainer has freshened it up for a specific target. Look for runs where the horse was denied a clear passage, or where the pace collapsed and hold-up horses had no chance. Those hidden clues transform raw form into genuine insight.
Form tells you what happened. The going report tells you what it happened on — and that context changes everything.
Going and Ground — The Variable Most Punters Underrate
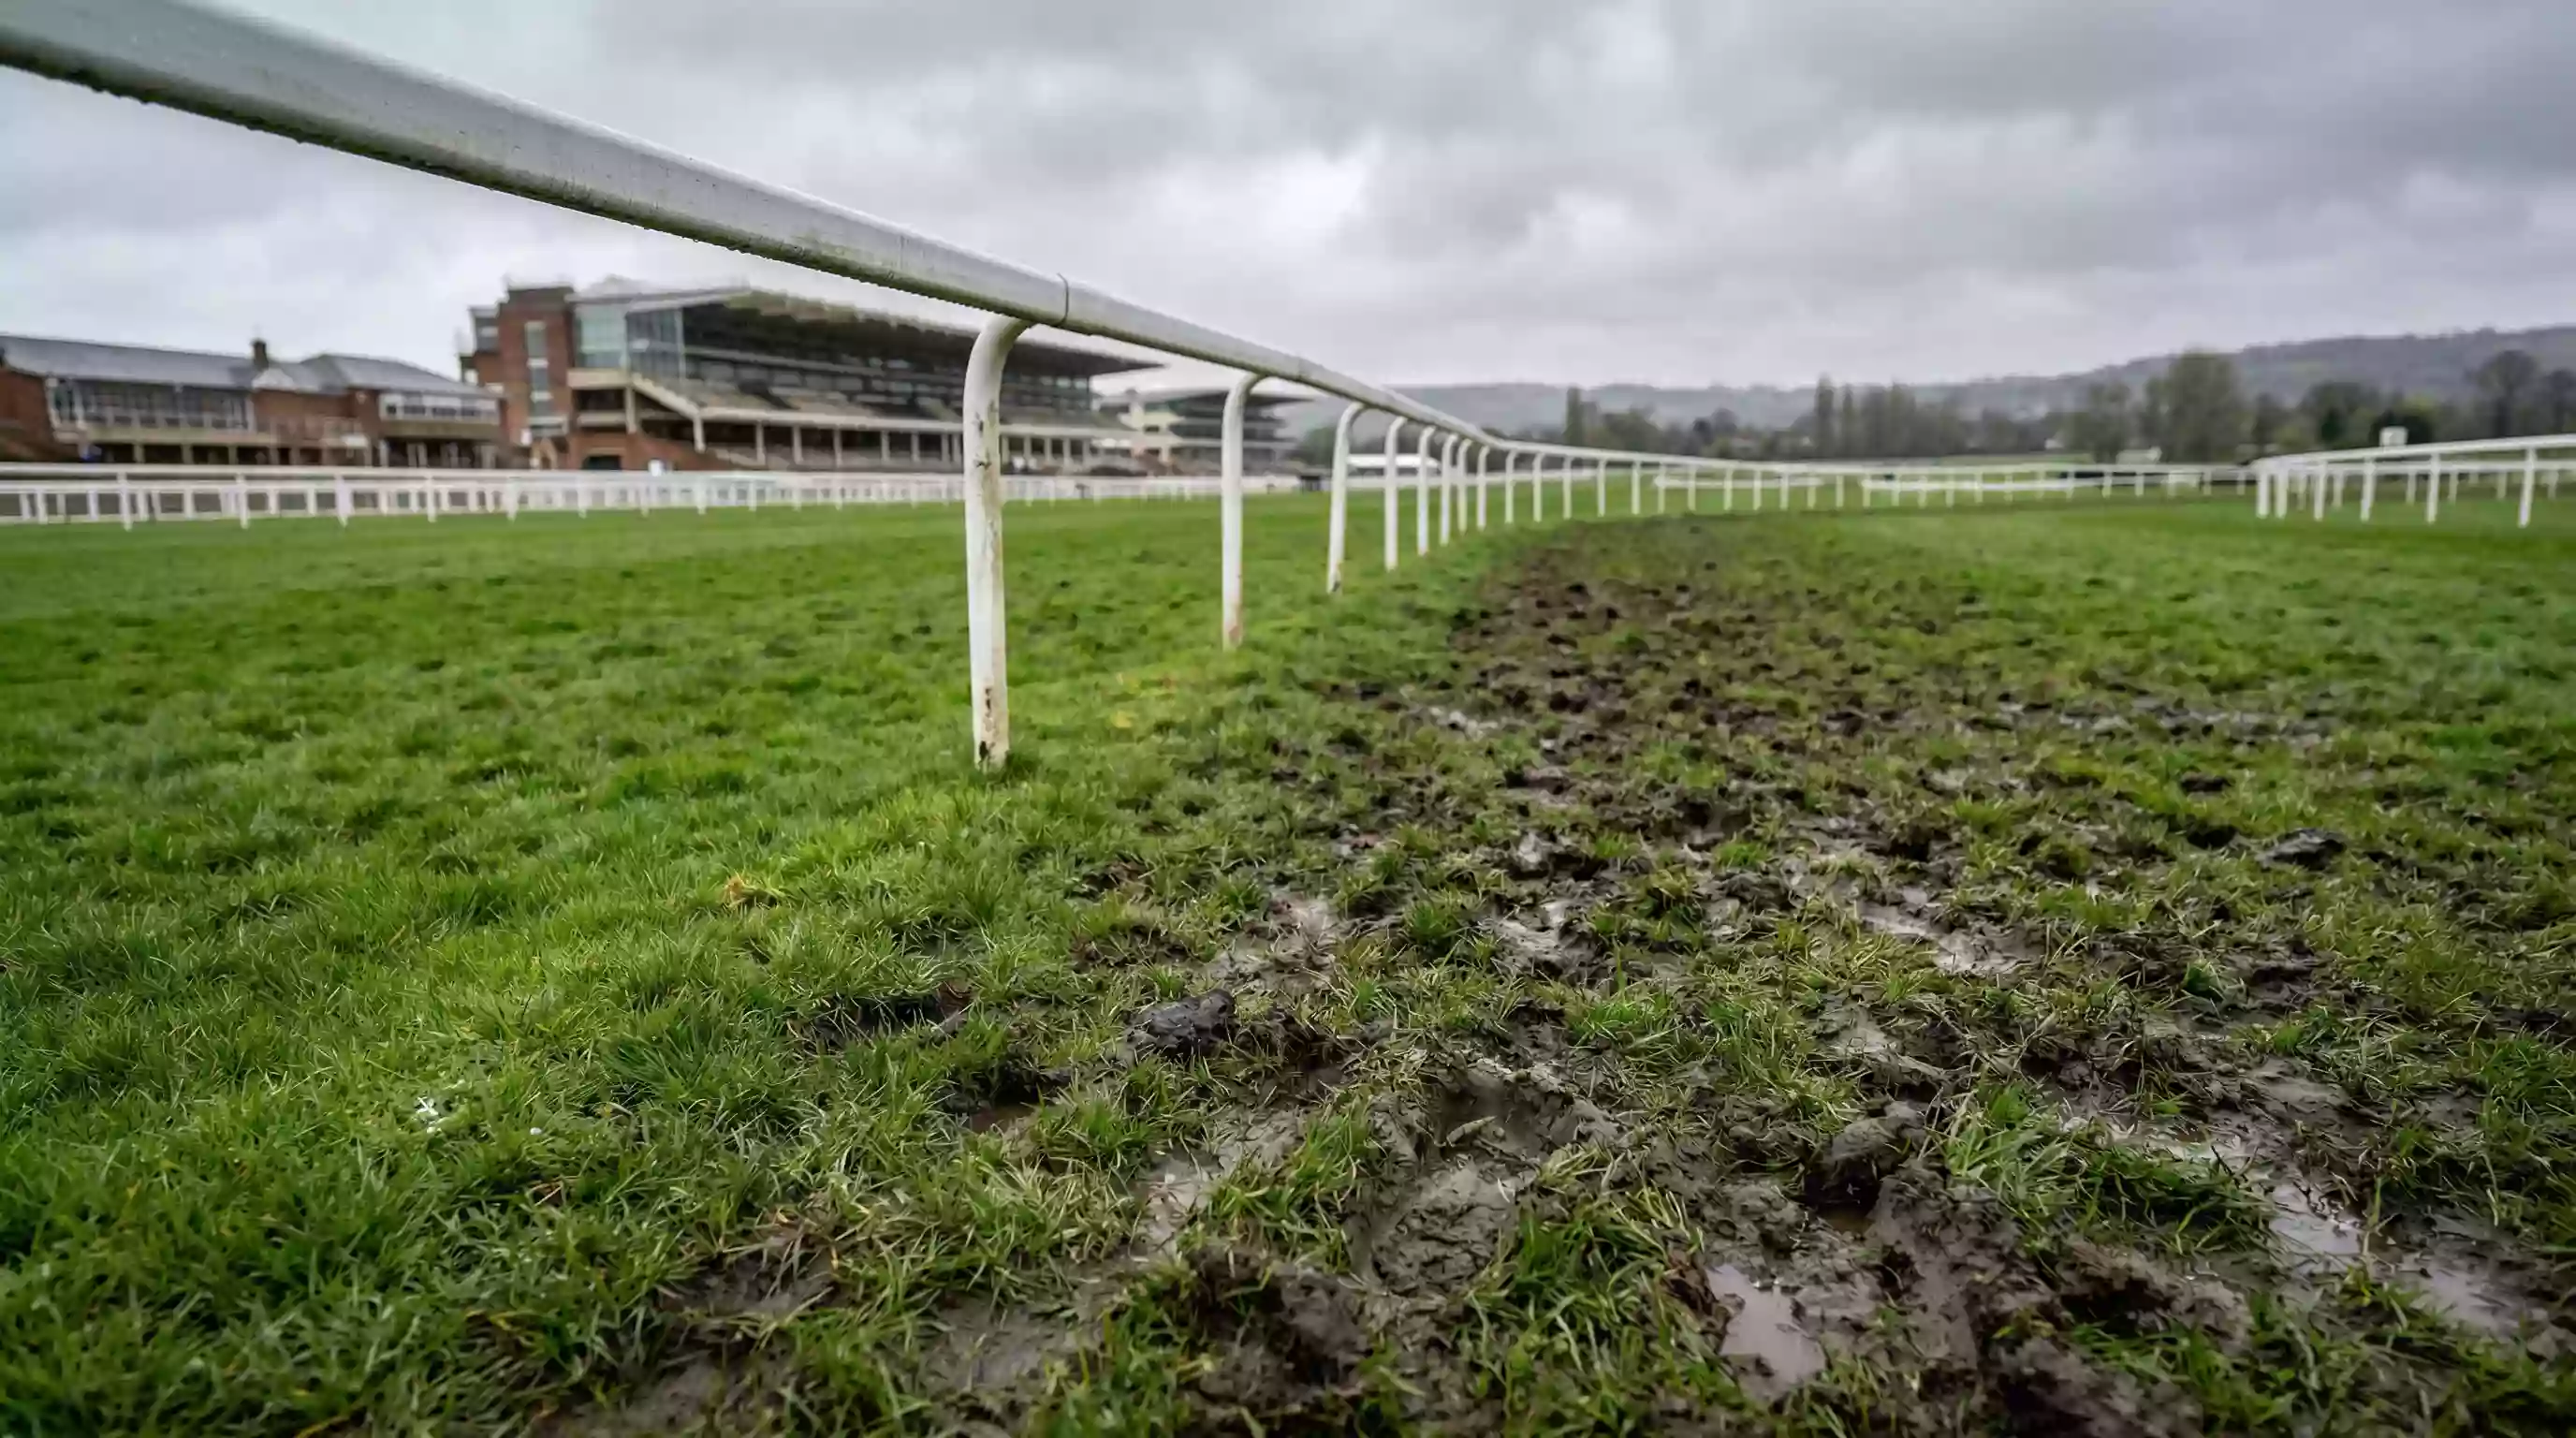
Every guide on picking winners tells you to "check the going." Very few explain what that actually means. The going — the state of the racing surface — is arguably the single most impactful variable in determining race outcomes, and it is the one most punters treat as an afterthought.
The UK going scale runs from Hard and Firm at the fast end through Good to Firm, Good, Good to Soft, Soft, and Heavy at the slowest extreme. Each step on this ladder changes how fast horses can travel, how much energy they expend and which running styles gain advantage. An analysis of 6,268 UK races between 2016 and 2024 by BetTurtle found that 71% to 85% of races took place on some variant of Good ground — Good to Firm, Good, or Good to Soft. Just 13% to 24% were run on Soft or Heavy, and only 3% to 9% on the fastest surfaces.
This distribution matters because most form data you study was compiled on Good ground. When the going shifts to either extreme — genuine Firm or Heavy — the form book becomes unreliable. Horses with no proven record on testing ground are unknowns, and that uncertainty creates opportunity for anyone who filters form by going.
Academic research has begun to quantify the relationship between surface conditions and performance. A 2024 study by Nottingham Trent University, based on 50 British turf meetings, found that horse speeds peak on firm ground but plateau at a cushioning level of approximately 10 kilonewtons — roughly two times a horse's body mass. Crucially, speed variability increases significantly on softer ground, meaning the gap between those who handle it and those who do not widens considerably.
"Detailed assessment of sports surfaces using our equipment demonstrates a real benefit," said Dr Jaime Martin, Senior Lecturer at Nottingham Trent University. "We are already starting to extend the work to include other surfaces, for example football pitches."
For the punter, the practical application is straightforward. Every horse in your shortlist should have its going record checked. A horse that has won three times on good ground but never placed on anything softer becomes a red flag when today's going is Good to Soft with further rain forecast. Conversely, a horse whose soft-ground form reads 1-2-1 but who was beaten out of sight last time on Good to Firm becomes an entirely different proposition when the heavens open.
Most UK races are run on Good ground, which means extreme going conditions turn the form book on its head. Filter your shortlist by going preference — it is one of the simplest and most effective edges available.
The going is announced by the clerk of the course and updated throughout a race day. It can change between the first and last race, particularly during spring and autumn meetings. Checking the forecast alongside the official going is part of any serious pre-race routine. The March meetings of the 2026 National Hunt season have already seen going descriptions shift from Soft to Heavy and back within a single fixture — a reminder that ground is a moving target, not a fixed label.
Trainer and Jockey — Follow the Connections
A horse does not prepare itself. Behind every runner is a trainer who decides when it races, over what trip, on what ground and with what jockey. Behind every ride is a jockey whose tactical decisions can be worth lengths. These connections are measurable, and measuring them adds predictive power that pure form analysis cannot provide.
Trainer strike rates are the most accessible starting point. During the 2025 UK Flat season, Charlie Appleby operated at a 33% strike rate — 52 winners from 160 runners — while Andrew Balding topped the trainers' championship with 110 winners from 553 starts at 20%, according to RaceShare. Those headline numbers are useful, but the real edge comes from slicing the data further. A trainer might have a 15% overall rate but run at 30% with first-time blinkers applied — that is the kind of angle that separates thorough analysis from casual observation.
In National Hunt racing, the concentration of talent at the top is even more pronounced. Analysis of televised NH races between 2022 and 2024 by BetTurtle showed Paul Nicholls leading with 63 wins, Nicky Henderson posting the best strike rate at 19.55%, and Willie Mullins — despite being the dominant force in Irish racing — delivering a return on investment of minus 33.41% to blind backers. That last figure is instructive: a great trainer does not automatically equal a good bet. Mullins sends superstars across the Irish Sea for the Cheltenham Festival, but they are typically sent off at prohibitively short prices that leave no value even when they win.
Jockey bookings are another signal worth monitoring. When a leading rider is booked for an unfancied horse in a competitive handicap, it often indicates the connections expect a big run. If a stable jockey is replaced by a less experienced rider, it can suggest the trainer does not regard the race as a priority. None of this is definitive — jockeys miss rides for mundane reasons — but patterns over time become meaningful.
Certain trainer-jockey combinations click at certain tracks. A trainer who consistently uses the same freelance jockey at Newmarket but switches at Chester is making deliberate tactical choices. Free tools like the Racing Post and At The Races let you filter results by trainer-jockey combinations, and the data is often revealing.
Trainer and jockey data tells you about intent and competence. Speed figures tell you about raw ability — and that is a different kind of evidence entirely.
Speed Figures and Ratings — Measuring True Ability
Form tells you where a horse finished. Speed figures attempt to tell you how fast it got there — and that distinction is critical for comparing horses who have never met on a racecourse. Two horses might both have won their last race. One did it by six lengths in a slow-run Class 5 at Catterick; the other won by a neck in a truly-run Class 3 at Newbury. Without speed figures, they look equally impressive on paper. With them, the Newbury winner is likely rated twenty to thirty pounds superior.
"A time won't necessarily tell you how good a horse is, but it will tell you how bad it isn't," Phil Bull, the founder of Timeform, once observed. That remains one of the most useful framings in the sport. Raw times alone are not enough — they need adjusting for going conditions, wind, course configuration and race pace. That is what speed rating systems do.
In UK racing, the two most widely used speed figures are Racing Post Ratings (RPR) and Topspeed. RPR incorporates collateral form, while Topspeed is a purer time-based figure. Neither is perfect, but both are far better than relying on finishing positions alone. They are published in the Racing Post, freely accessible on the racecard page.
The concept of class par is where speed figures become genuinely powerful. Every class of race has an approximate speed threshold — the minimum rating a horse typically needs to achieve to be competitive. Horses consistently running below class par for the race they are entered in have a win rate of roughly 4% in handicaps, according to analysis by Caan Berry. On the other hand, the horse posting the top speed figure in a race wins approximately 35% of the time, according to data from Sportily. That single filter — who has the best speed figure and who is running below par — can cut a twelve-runner field in half before you look at anything else.
Speed Figure Filter in Practice
A Class 4 handicap over a mile at York might have a class par of Topspeed 72. Of twelve runners, four have never achieved higher than 65 — they are running below par and historically win only 4% of the time. Five runners have achieved 73 or above. That top group is your shortlist. Now apply going preference, trainer form and draw bias to the five who clear par.

Speed figures also help detect improvers. A three-year-old who ran 68, 71, 74 in successive races is on an upward curve. If today's class par is 76, the trend suggests it might get there. That trajectory, combined with evidence from the trainer and the horse's pedigree, can justify a bet on potential rather than proven ability — though the price needs to reflect the uncertainty.
Draw and Post Position — When the Stall Decides the Race
At some UK racecourses, a horse's chance of winning is significantly influenced before it even leaves the stalls. Draw bias — the statistical advantage or disadvantage conferred by the starting position — is one of the most underappreciated factors in race selection, partly because it varies enormously by course, distance and going conditions.
Chester is the most extreme example. The tight left-handed circuit means that horses drawn low — closest to the inside rail — have a dramatically shorter distance to cover. On the five-furlong course, 63% of winners have come from stalls 1, 2 and 3, according to data analysed by Smarkets. That is not a marginal edge. That is a structural advantage so large that it should be factored into any assessment of a Chester sprint before form, going or trainer intent are even considered.
Chester is not unique, just the most pronounced. At Catterick, stalls 1 to 3 in sprint races overperform their expected win rate by roughly 40%. At Thirsk, horses drawn in the top third win approximately 45% of races where the expected figure would be closer to 33%. These are statistically significant biases that appear consistently over large samples, and they exist because of course geometry — tight bends, uphill finishes, prevailing camber.
The effect is not constant, though. Draw bias tends to be amplified on faster ground, where horses cannot make up lost ground as easily because the field strings out at higher speeds. On heavy ground, when the pace collapses and the field bunches, draw advantages can diminish. Field size matters too — in small fields of five or six runners, draw bias is less meaningful because horses have room to manoeuvre; in large-field handicaps of fifteen-plus runners, the stall you draw from can be the single biggest factor in whether you get a clear run.
The practical application is to keep a reference of known draw biases at the major UK flat courses. Several free tools — including the Racing Post's course guides and LightSpeed Stats — compile draw data updated seasonally. When analysing a race at a course where draw bias exists, weight it accordingly. A horse with strong form but a wide draw at Chester is fighting against geometry, and the price rarely compensates.
Pace and Race Shape — Who Sets the Fractions?
Pace is the hidden architecture of every race. Two races at the same course over the same distance can produce entirely different results depending on how fast the early fractions are run. A race where one horse blazes clear from the front produces a different kind of test from a race where nothing goes faster than a hack canter until the three-furlong pole. Understanding pace — and predicting it from the entries — gives you an advantage that most punters never bother to acquire.
"Basic physics and bioenergetics tells us that a horse which spends its energy in a non-optimal way will compromise the overall speed at which it gets from A to B," explains Simon Rowlands, the former Timeform analyst. That principle has direct consequences for selection. A front-runner who gets a soft lead, dictating the pace unchallenged, uses its energy far more efficiently than one locked in a speed duel. The data confirms this: lone front-runners outperform their expected win rate by roughly 35%, a finding from Nick Mordin's research analysed by LightSpeed Stats.
Conversely, strong finishers benefit when the pace is genuinely fast. Closers in fast-run races outperform by about 30% compared to expectation, because the leaders burn themselves out. This is why pace and draw analysis interact closely. At Chester, pace data shows leaders win approximately 25% of races versus a national average of around 15%. At Newmarket's July Course, hold-up horses overperform the national average by roughly 20%.
Predicting the pace requires looking at every runner's established style. When a race has three or four front-runners engaged, the odds of a fast pace and a messy race for the leaders increase — benefiting closers. When only one horse in the field habitually leads, that horse has a tactical advantage worth factoring into your assessment.
Pace maps — visual representations of predicted running positions — are available from services like Timeform and LightSpeed Stats. Note each horse's running style from its last three races, identify how many will vie for the lead, and ask whether today's course suits front-runners or hold-up horses. When the answers are clear, they represent one of the strongest signals available.
Pace and draw define how a race unfolds. Value betting defines whether the price justifies your assessment of who will benefit.
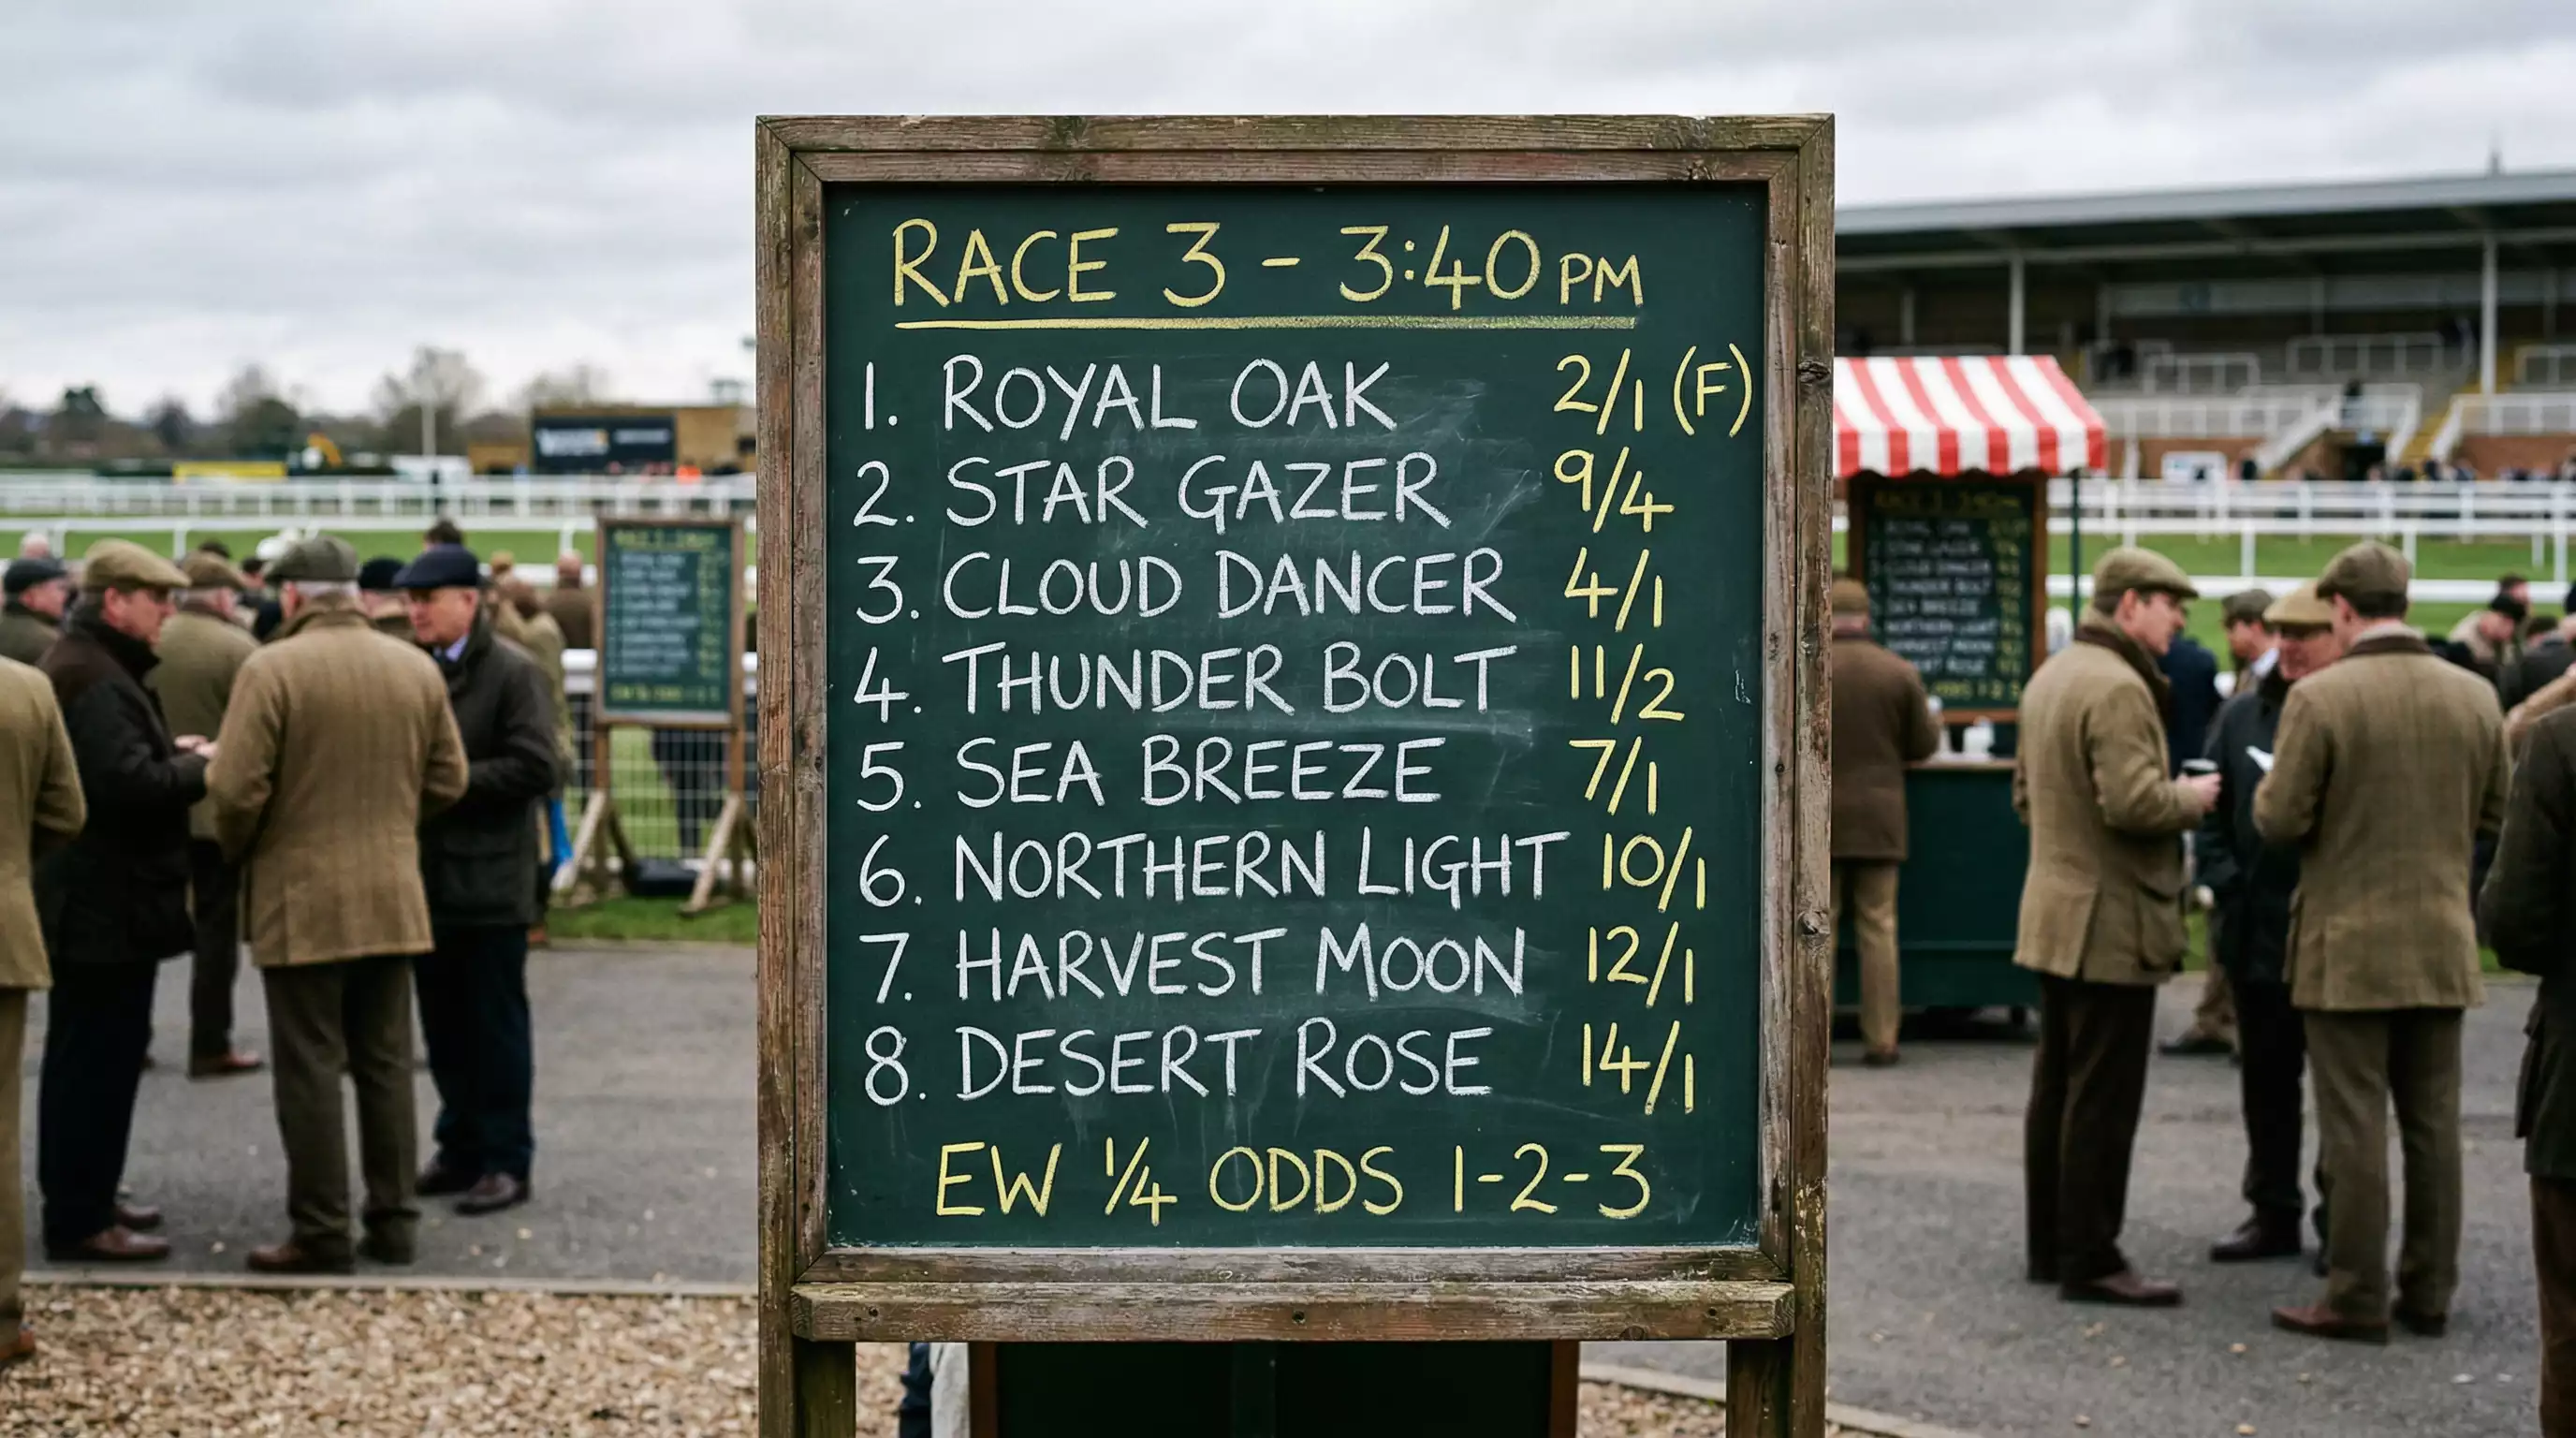
Value Betting — When Price Meets Probability
Everything up to this point — form, going, speed figures, draw, pace — is about estimating a horse's chance of winning. Value betting is about comparing that estimate to the price on offer. If you believe a horse has a 25% chance and it is available at 5/1 (implied probability 16.7%), you have found value. If the same horse is 2/1 (33.3%), you have not. This distinction is the dividing line between recreational punting and disciplined betting.
The data on favourite performance by price band illustrates why value matters. On UK Flat turf, odds-on favourites win approximately 59% of their races. At odds of 1/2 and shorter, the rate climbs to around 74%. But at 8/1 and beyond, the favourite manages just 8%, according to FlatStats. A well-supported favourite at even money should win roughly half the time. If your analysis agrees with the market, there is nothing to bet on. You are looking for the gaps: the 4/1 shot your work says should be 5/2, or the 8/1 chance your going, draw and pace analysis says is closer to 4/1.
Blind backing of all favourites generates a return on investment of roughly 93% — a 7% loss over time. That figure comes from a five-year UK dataset analysed by Win2Win and confirms what you would expect: the bookmaker's overround ensures that backing the obvious choice is a losing strategy in the long run. The path to profitability requires finding instances where the market has it wrong.
This is where the favourite-longshot bias enters the picture. The landmark study by Snowberg and Wolfers, published as an NBER working paper analysing 5.6 million race starts, found that returns decline as risk increases. Favourites are marginally underbet — their implied probabilities slightly understate their actual chances — while longshots are consistently overbet. UK-specific research by Smith and Vaughan Williams confirmed this bias, though the introduction of betting exchanges reduced its magnitude.
The practical takeaway is not to avoid longshots entirely but to be disciplined about them. A 20/1 shot with genuine claims backed by your analysis is a fine bet. A 20/1 shot backed by hope is not. Academic evidence suggests the greatest value tends to sit in the mid-range — horses priced between roughly 3/1 and 8/1 — where market efficiency leaves room for the informed punter to exploit.
Value is not about which horse will win. It is about whether the price on offer exceeds the horse's actual chance of winning. Your analysis estimates the probability; the market provides the price. Bet only when your figure is higher than the market's.
Breeding and Pedigree — What the Bloodline Tells You
Pedigree analysis occupies a peculiar position in the handicapper's toolkit: overrated by the uninitiated, underrated by many experienced analysts, and genuinely useful in specific situations. The science is clear that genetics influence racing performance, but the degree of that influence varies depending on what you are measuring.
Research published in ScienceDirect on the heritability of thoroughbred racing traits found that racing time has a heritability of 0.1 to 0.2 — meaning genetics account for 10–20% of the variation in race times, with the rest determined by environment, training and the conditions on the day. For earnings and handicap ratings, the heritability rises to 0.3–0.4, because these measures reflect sustained performance across multiple runs where genetic talent has more room to express itself.
What this means in practice is that pedigree is a blunt tool for predicting a single race result but a useful tool for predicting the type of conditions a horse might handle. Sire lines carry tendencies: some transmit a preference for soft ground, others are associated with precocious two-year-old speed, others produce stamina that only comes to the fore over longer trips. When a horse is tackling unfamiliar conditions — trying soft ground for the first time, stepping up in trip beyond a mile — the sire's profile offers a reasonable prior.
A genetic study by McGivney et al. found that 97% of modern thoroughbred pedigrees contain Northern Dancer, the Canadian champion whose bloodline has become virtually universal. In Europe, 35% of pedigrees trace to Sadler's Wells; in Australasia, 55% include Danehill.
The dominance of a handful of sire lines limits pedigree's discriminatory power — if virtually every horse traces to Northern Dancer, the gene pool is narrower than it looks. Where breeding analysis adds genuine value is in niche scenarios: a lightly raced three-year-old stepping up to a mile and a half whose dam won a Group 3 over twelve furlongs on heavy ground at Longchamp tells you something useful about stamina potential that form alone cannot confirm. In such cases, pedigree is the tiebreaker, not the primary evidence.
The Parade Ring — Reading a Horse Before It Runs
The paddock is the only part of your analysis that happens in real time. Everything else — form, speed figures, trainer stats — is retrospective. The parade ring lets you assess a horse's physical condition and mental state minutes before it races, and while it will never override strong data, it can confirm or raise doubts about your shortlist.
What to look for starts with the coat. A horse in peak condition has a shine — the coat lies flat, catches the light and looks healthy. A dull, staring coat can indicate a horse that is not thriving, though it is worth noting that many horses in winter National Hunt racing carry thicker coats that naturally look less polished. Muscle tone matters too: a fit horse moves fluidly, with defined muscle over the quarters and through the shoulder. One that looks light in its frame or heavy in the belly may not be at peak fitness.
Demeanour is harder to read but equally informative. A horse walking calmly, ears pricked, showing interest in its surroundings is generally in a good mental state. Excessive sweating can signal anxiety, though some horses sweat up routinely and still perform well. The key is knowing the individual: deviation from a horse's normal pattern is the signal, not the absolute behaviour.
Paddock inspection works best when used as a final check rather than a primary selection tool. If your form analysis, going preference filter and speed figures all point toward a horse, and it looks well in the ring, that is a green light. If it looks dull-coated, reluctant and heavily lathered, you have a reason to pause — and possibly to look at the next horse on your shortlist instead.
Flat vs National Hunt — Adjusting Your Method
The analytical framework described in this guide applies to both codes of UK racing, but the weight you give each factor shifts depending on whether you are studying a five-furlong sprint at Epsom or a three-mile chase at Haydock. Flat racing and National Hunt racing test different attributes, reward different running styles and are shaped by different variables — and your method needs to flex accordingly.
On the Flat, speed is king. Races are shorter, fields are often larger and the margins between horses are measured in fractions of a second. Draw bias matters more because stall position has a direct impact on how far a horse travels. Speed figures carry greater weight because time-based performance is easier to compare when every race is run on the level without obstacles. Trainer and jockey data is important but the sheer volume of Flat racing — particularly at the lower classes — means strike rates can fluctuate with sample size.
In National Hunt racing, jumping ability introduces a variable that does not exist on the Flat. A horse can be the best on form and the fastest on speed figures — but if it makes a mistake at the third-last fence, none of that matters. NH form analysis places more emphasis on how a horse jumps, how it handles different obstacle types and how it copes with longer distances on testing ground. Going preference is even more impactful in NH racing: in the first quarter of the year, 58% of UK races are run on Soft or worse — an environment where ground specialists thrive and flat-bred types flounder.
Stamina is a bigger factor over jumps, where races extend to four miles and beyond at the extreme. Trip analysis — whether a horse truly gets the distance — carries more weight in NH racing. If you are transitioning from Flat to NH analysis, or vice versa, recalibrate which factors sit at the top of your hierarchy rather than starting from scratch.
The Racing Calendar — When Going, Fitness and Fields Shift
British racing runs year-round, but its character changes with the seasons. The types of races on offer, the quality of the fields, the state of the ground and the fitness profiles of the horses all follow a seasonal rhythm — and understanding that rhythm helps you calibrate your analysis to the time of year.
The year opens with the core of the National Hunt season. January through March is dominated by jumps racing building toward the Cheltenham Festival in mid-March and the Grand National meeting at Aintree in April. Ground conditions in this period reflect the British winter: data from BetTurtle's eight-year study shows that 58% of races in Q1 take place on Soft or Heavy going. This drops sharply to 15% in Q2 and just 13% in the height of summer, before rising again to 38% in Q4 as autumn rain returns. If your form analysis does not account for this seasonal shift, you are effectively comparing apples with oranges.
Spring marks the crossover. The Flat turf season traditionally opens in mid-April, though all-weather racing continues year-round. Early-season Flat runners are often unfit after a winter break, making recent form less reliable and increasing the importance of trainer intent. Looking for trainers with strong early-season records, or horses who performed well at the backend of the previous campaign, can identify live contenders when the form book is thin.
Summer is the Flat's peak. Royal Ascot in June, Glorious Goodwood in late July and the Ebor Festival at York in August represent the highest-quality racing of the year. Going is typically Good or faster, and speed figures from this period are the most comparable because conditions are relatively stable.
Autumn brings transitions. The backend of the Flat season runs into October and November, with ground softening progressively. National Hunt racing ramps up again from October onward. Horses returning from summer breaks may need a run or two before hitting peak form. The 2026 spring jumps season has seen several cards affected by persistent rain, with courses reporting ground significantly softer than seasonal averages — a pattern worth tracking as it develops.
Mistakes That Cost You Winners
Most punters do not lose because they lack information. They lose because they weight the wrong information. Simon Rowlands put it plainly when asked about the biggest errors in racing analysis: "Undervalued information probably includes trainer form and 'form' itself, while sectionals are not widely available but can be tapped into by anyone who has the time and is prepared to put in some effort. Overvalued information includes what trainers and jockeys say, and trends."
That hierarchy is worth absorbing. The things most punters pay attention to — what a trainer says in a press interview, what jockey booking looks significant, which horse "should" win based on a newspaper tipster's column — are the least reliable inputs. The things that require effort to access and interpret — detailed form, speed figures, going records, pace analysis — are the most reliable. The mistake is not laziness per se; it is misplaced confidence. Punters trust the easy signal (a confident quote, a stable "whisper") over the hard data (a systematic comparison of speed figures against class par).
Other common errors include chasing losses, overreacting to a single result, ignoring going changes on the day, and neglecting the draw in sprint handicaps. There is also the temptation to bet too many races. Selectivity is not timidity — it is discipline. Professional analysts often let entire cards pass without a bet, not because they cannot find a selection but because no selection offers sufficient value at the available price.
Perhaps the most insidious mistake is confusing outcome with process. A winning bet placed for the wrong reasons teaches you nothing and reinforces bad habits. A losing bet placed for the right reasons — solid analysis, correct identification of value, proper stake size — is part of any winning long-term record. Variance is real. The question is whether your process, applied over hundreds of bets, produces a positive expectation.
Tools and Resources — Where to Find Everything
The good news for anyone serious about form study is that the UK racing ecosystem provides a wealth of free or low-cost data. You do not need expensive subscriptions to apply the methods in this guide — though premium tools can save time once your process is established.
For form and racecards, the Racing Post website remains the industry standard. Every runner's form, speed figures (RPR and Topspeed), going record, course-and-distance history, and trainer-jockey statistics are accessible on the racecard page. At The Races offers a similar depth with a slightly different presentation. Both are free to use at the basic level.
Going reports are published by each racecourse and aggregated by the Racing Post and the BHA. The official going is updated on race morning and sometimes again before the first race. For weather, the Met Office's site-specific forecasts for racecourse locations are more useful than a general regional outlook.
Speed figures beyond RPR and Topspeed are available from Timeform (subscription), while free alternatives include Proform Racing and various Racing Post tools. For draw bias data, the Racing Post course guides are a solid starting point, and LightSpeed Stats provides detailed pace and draw analysis broken down by course. Trainer statistics, including seasonal trends and course-specific records, can be found on RaceShare and the Racing Post's trainer profiles.
Race replays are freely available through the Racing Post and At The Races. They are invaluable for identifying horses that encountered trouble in running — information that form figures alone cannot convey. If you are going to invest time in one area of study, replays offer arguably the best return per hour spent.
Frequently Asked Questions
How often do favourites win in horse racing?
Across all British racing, the favourite wins approximately 30–35% of the time. A twenty-year study covering 2002 to 2021 put the figure at roughly 34%, with the second favourite winning around 20% and the third about 13%. Combined, the top three in the market account for 65–70% of all winners. Performance varies by price: odds-on favourites win approximately 59% of races, while those at 8/1 or longer manage only about 8%. At the 2024 Grand National Festival, favourites won 7 of 21 races — in line with the historical average. Despite their high win rate, backing all favourites blindly returns roughly 93p in the pound — a 7% loss over time. The edge comes from identifying which favourites represent value and which are inflated by public money.
What is the easiest way to pick a winner in horse racing?
There is no shortcut, but there is a four-step framework that covers the essentials. First, narrow the field: focus on the top five in the betting market, where 75–80% of winners originate. Second, check conditions: filter by going preference and draw bias, eliminating horses unsuited to today's surface or stall position. Third, compare ability: use speed figures to identify which horses have achieved the class par required to win this race. Fourth, assess the price: estimate each contender's approximate win probability and compare it to the odds — only bet when the price exceeds your assessment. This process takes fifteen to twenty minutes per race once familiar with the tools.
Does the going really affect which horse wins?
Emphatically, yes. Going is one of the most significant variables in race outcomes. An eight-year analysis of over 6,000 UK races found that 71–85% are run on some variant of Good ground, meaning races on Soft, Heavy or Firm represent a substantial departure from the norm that reshuffles the form book. Academic research from Nottingham Trent University confirmed that horse speeds peak on firm ground and show significantly greater variability on soft ground — meaning the gap between horses who handle soft conditions and those who do not widens considerably. Any horse on your shortlist should have its going record checked before you commit.
Building Your Method
No single factor picks winners consistently. Not form alone, not speed figures, not trainer stats. What picks winners is a method — a structured process that weighs the evidence for each race and arrives at a probabilistic assessment. This guide has laid out the building blocks: narrowing the field via market position, reading form in context, filtering by going and draw, measuring ability through speed figures, analysing pace, and subjecting every selection to the discipline of value assessment.
Your method will not look exactly like anyone else's, and it should not. Some punters develop a particular strength in going analysis; others gravitate toward speed figures and class par; some focus on National Hunt racing where jumping ability adds complexity. The point is not to master every factor equally but to build a process you trust and refine as your understanding deepens.
Start with the basics: form, going and speed figures. Add trainer data and draw bias as your confidence grows. Introduce pace analysis once you are comfortable reading running styles from replays. Keep records of your bets — what you backed, why and at what price — because over time those records tell you where your method works and where it does not.
The racing calendar in 2026 offers no shortage of opportunities to put this into practice. The spring jumps season is in full swing, the Flat turf campaign opens in April, and the major festivals — Cheltenham, Aintree, Royal Ascot, Glorious Goodwood, York's Ebor — punctuate the year with the highest-quality racing in the world. No hunches. No hype. Just form, data and method. That is how you pick a winner.